.png)
Why Baseload Commands 3x the price of Solar
Understanding Industrial Facilities Pay USD $0.12-0.18/kWh for Biomass vs. USD $0.04-0.06/kWh for Solar
Last Updated: Oct 20265 | Reading Time: 4 minutes
Solar PV installations deliver electricity at USD $0.035-0.055/kWh in favorable locations.
Yet industrial facilities with 24/7 requirements consistently choose biomass-based baseload power at USD $0.12-0.18/kWh—paying 3-4x more per kilowatt-hour.
This pricing reveals a fundamental truth: cost per kilowatt-hour is not the cost of reliable electricity. For facilities that cannot shift production schedules or tolerate outages, baseload renewable power is not "expensive"—it's the only viable solution.
The Intermittency Reality
Capacity factors:
- Solar PV Malaysia: 15-18%
- Solar PV Colombia: 18-22%
- Wind Malaysia: <12% (unsuitable for commercial wind)
- Wind Colombia: 28-38% (coastal/highland regions only)
- Biomass pyrolysis: 85-95%
A 2 MW solar installation generates 2,920-4,380 MWh annually. A 2 MW biomass plant generates 14,892-16,644 MWh annually—3.4-5.7x more electricity from identical nameplate capacity.
But capacity factor understates the challenge. Solar generates zero output at night, reduced output during cloud cover. Industrial facilities operate on production schedules, not weather patterns.
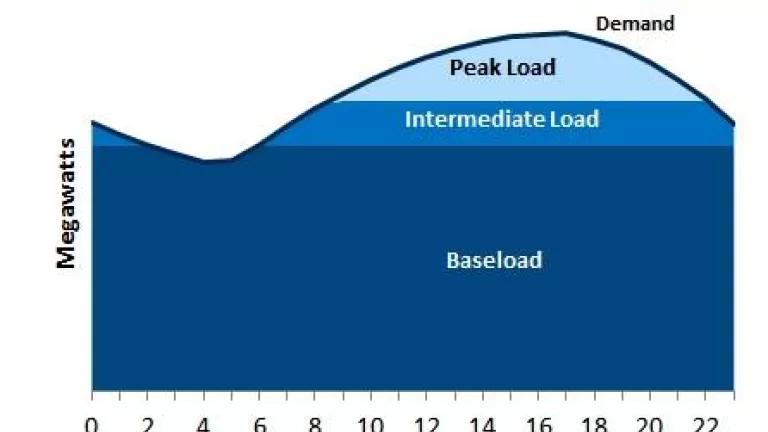
Industrial Load Profiles: Manufacturing Cannot Follow the Sun
Palm Oil Mill (60 tonnes FFB/hour):
- Sterilization: 800-1,200 kW continuous
- Extraction/clarification: 400-700 kW
- Processing/utilities: 350-600 kW
- Total: 1.55-2.50 MW continuous during 16-18 hour days
- Peak demand during morning sterilizer start-up when solar output is ramping
- Consistent evening demand when solar output falls to zero
Rice Milling (15 tonnes/hour):
- Grain drying: 600-900 kW (time-sensitive, runs post-harvest regardless of time)
- Milling/polishing: 300-500 kW
- Total: 1.05-1.65 MW with critical processes that cannot be interrupted
All facilities share common constraints:
- Process requirements that cannot shift to solar peak hours (10 AM - 2 PM)
- Time-sensitive operations when raw materials arrive
- Continuous demand extending into evening (6-10 PM) when solar output is zero
- Equipment requiring stable power to prevent damage

The Battery Storage Trap
Capital costs:
- Lithium-ion storage: USD $300-500/kWh installed
- 2 MW facility requiring 16-hour baseload needs 32 MWh storage
- Battery cost: USD $9.6-16 million
- Solar PV to charge batteries: USD $4-6 million (6-8 MW oversized)
- Total: USD $13.6-22 million for solar + storage vs. USD $12-18 million for 2 MW biomass
Operational constraints:
- Battery life: 4,000-6,000 cycles (10-15 years)
- Capacity degradation: 20-30%
- Replacement cost: USD $9.6-16 million every 10-15 years
- Round-trip efficiency loss: 10-15%
Land requirements:
- 6-8 MW solar: 12-18 hectares (30-45 acres)
- 32 MWh batteries: 400-600 m² climate-controlled space
- 2 MW biomass: 0.12-0.18 hectares (0.3-0.45 acres)
- Solar + storage uses 67-100x more land
Grid Integration: Hidden Costs of Intermittent Power
Even facilities with solar must maintain grid connection for:
- Nighttime operations
- Cloudy day operations (60-90% output drop)
- Morning/evening operations
- Backup during maintenance
Grid charges:
- Demand charges: USD $8-15/kW/month
- Capacity reservation: USD $5-12/kW/month
- 2 MW facility pays: USD $192,000-432,000 annually even with solar offsetting 60-70% of energy
Biomass baseload eliminates these charges—grid connection only for emergency backup and export.
Total Cost of Ownership Analysis
Solar + Storage (6 MW to match 2 MW biomass annual output):
- Capital: USD $13.8-22.6M
- Land cost/lease: USD $180,000-480,000
- Grid capacity charges: USD $192,000-432,000/year
- O&M: USD $180,000-320,000/year
- Battery replacement reserve: USD $640,000-1,100,000/year
- 20-year total: USD $40.8-69.2 million
- Lifetime LCOE: USD $0.155-0.263/kWh
Biomass Baseload (2 MW):
- Capital: USD $12-18 million
- Grid charges: Zero
- O&M: USD $220,000-380,000/year
- Feedstock: Zero (facility waste)
- 20-year total: USD $21.2-33.8 million
- Lifetime LCOE: USD $0.071-0.113/kWh
The apparent solar "cost advantage" disappears when total system costs are calculated. Industrial buyers pay USD $0.12-0.18/kWh for reliability, availability, power quality, and grid independence—not just electrons.

Biomass Baseload: Technical Advantages Justifying Premium
Dispatchability: Operates when facility needs electricity, not when weather permits. Can ramp for peak demand, run extended hours during harvest season.
Grid Independence: Operates during grid outages, brownouts, voltage instability. Critical for facilities in areas with unreliable grid service.
Triple Revenue Model:
- Electricity generation: USD $1.8-2.4M/year
- Biochar product sales: USD $450,000-1.68M/year (agricultural/concrete applications)
- Carbon credit revenue: USD $820,000-1.125M/year (permanent removal at EUR 80-150/tonne CO₂)
- Total annual value: USD $3.2-5.8M
Against USD $12-18M capital cost = 18-48% annual ROI.
Solar + storage cannot replicate this value stack—it generates electricity intermittently, processes no waste, produces no co-products, doesn't qualify for premium carbon credits.
Regional Economics
Malaysia (2025-2026):
- Grid industrial: RM 0.65-0.75/kWh (USD $0.16-0.18/kWh)
- Solar + storage LCOE: USD $0.155-0.215/kWh
- Biomass baseload LCOE: USD $0.095-0.135/kWh
- Biomass saves: 18-40% vs. grid, 13-37% vs. solar + storage
Colombia (2025-2026):
- Grid industrial: COP 884/kWh (USD $0.23/kWh)
- Solar + storage LCOE: USD $0.165-0.235/kWh
- Biomass baseload LCOE: USD $0.105-0.155/kWh
- Biomass saves: 33-54% vs. grid, 4-34% vs. solar + storage
Both markets have abundant agricultural waste (palm oil, rice, coffee, sugarcane), making feedstock availability a strength.
Policy Support for Baseload Renewable
Malaysia National Energy Transition Roadmap:
- Biomass/biogas: 2,000 MW target by 2035
- Net Energy Metering for surplus export
- Recognition that intermittent renewables alone cannot achieve energy security
Colombia National Energy Plan 2022-2050:
- 19,000 MW non-conventional renewable capacity by 2050
- Biomass support for agricultural regions to reduce 70% hydroelectric dependency
- Self-generation with grid export at spot price (CREG 135/2021)
Countries dependent on intermittent renewables (Germany, California) experienced grid instability in 2022-2024. Policy increasingly emphasizes:
- Capacity payments for dispatchable renewable generation
- Enhanced compensation for baseload power
- Grid stability services from renewable generators
Conclusion
The 3x premium for biomass baseload is accurate market pricing for fundamentally different products:
Intermittent Solar delivers:
- Low-cost electrons during favorable weather
- Peak output that may not align with demand
- Grid-dependent backup requirement
- Massive land and storage for 24/7 service
- No waste processing or co-product revenue
Baseload Biomass delivers:
- Reliable 24/7 on-demand electricity
- Grid independence and power quality
- Valuable co-products and carbon credits
- Compact footprint on existing property
- Lower total cost of ownership
For 24/7 operations, the question isn't "why pay 3x more for baseload power?" The question is: "Why invest in intermittent generation that cannot run our facility?"
For industrial buyers, electricity generation capacity and electricity availability are not the same thing—and for continuous operations, availability is worth the premium.
References
- BloombergNEF. (2025). Levelized Cost of Energy 2025: Global Comparison of Power Generation Technologies. Bloomberg Finance L.P.
- International Renewable Energy Agency (IRENA). (2024). Renewable Power Generation Costs 2024. IRENA Publications.
- National Renewable Energy Laboratory (NREL). (2024). Annual Technology Baseline 2024: Electricity Generation Technology Cost and Performance. U.S. Department of Energy.
- International Energy Agency (IEA). (2024). Grid Integration of Variable Renewables: Best Practices for System Reliability. IEA Energy Papers.
- Malaysia Energy Commission. (2023). National Energy Transition Roadmap (NETR) 2023-2050. Suruhanjaya Tenaga Malaysia.
- Colombian Ministry of Mines and Energy. (2022). National Energy Plan 2022-2050: Diversification and Decarbonization Strategy. MinMinas Colombia.
- Electric Power Research Institute (EPRI). (2024). Energy Storage Technology and Cost Assessment 2024. EPRI Technical Report.
- Lazard. (2024). Levelized Cost of Energy Analysis - Version 17.0. Lazard Financial Advisory.
- National Renewable Energy Laboratory (NREL). (2023). Renewable Electricity Futures Study: Grid Integration Technical Analysis. Technical Report NREL/TP-6A20-82687.
- World Bank Energy Sector Management Assistance Program (ESMAP). (2024). Mini Grids and Renewable Energy in Developing Countries: Technology Cost and Performance Benchmarking. World Bank Publications.
- International Finance Corporation (IFC). (2024). Utility-Scale Solar and Wind: Best Practices for Procurement and Grid Integration. IFC Advisory Services.
- Enerdata. (2024). Global Energy Market Analysis: Industrial Electricity Pricing and Renewable Energy Economics. Enerdata Intelligence Reports.

.avif)